The Best of Creative Computing Volume 1 (published 1976)
The Automobile and Air Pollution (statistics on relationship between cars and air pollution, reprinted from Air Pollution Student Lab booklet from Hewlett-Packard)

The Automobile and Air Pollution*

by Herbert D. Peckham, Gavilan College

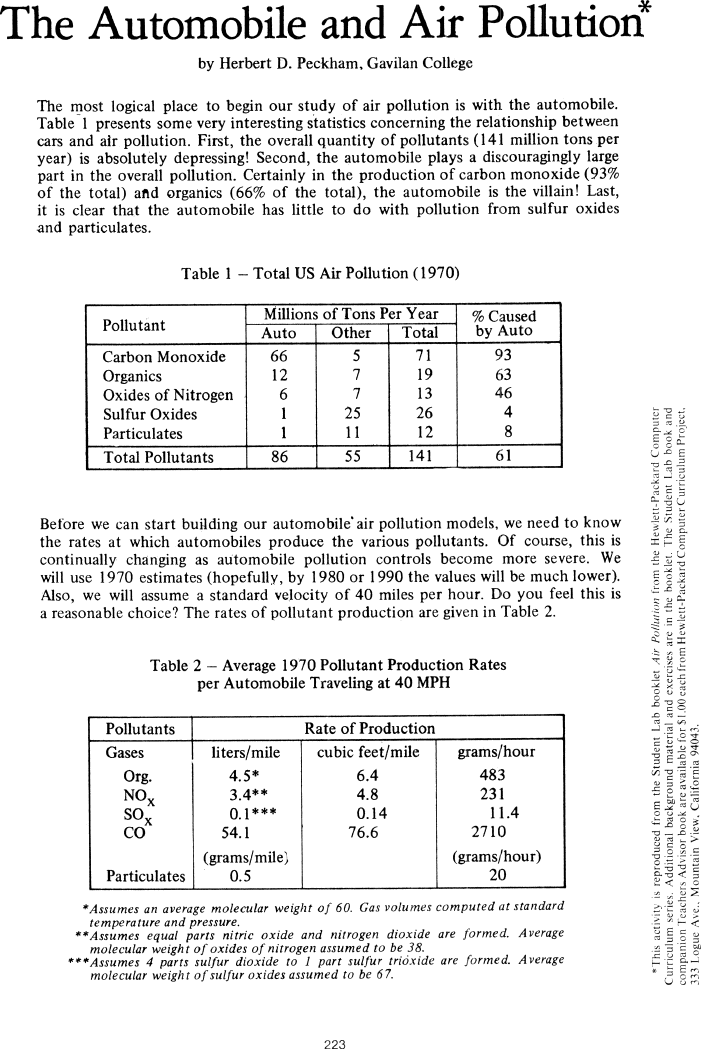
The most logical place to begin our study of air pollution is with the
automobile. Table 1 presents some very interesting statistics concerning the
relationship between cars and air pollution. First, the overall quantity of
pollutants (141 million tons per year) is absolutely depressing! Second, the
automobile plays a discouragingly large
part in the overall pollution. Certainly in the production of carbon monoxide
(93% of the total) and organics (66% of the total), the automobile is the
villain! Last, it is clear that the automobile has little to do with pollution
from sulfur oxides and particulates.


Table 1 ~ Total US Air Pollution (1970)

			Millions of Tons Per Year % Caused
Pollutant 		      Auto  Other  Total   by Auto
Carbon Monoxide 		66   5    71          93
Organics 			12   7    19          63
Oxides of Nitrogen 		 6   7    13          46
Sulfur Oxides 			 1  25    26  	       4
Particulates			 1  11    12           8
Total Pollutants 		86  55   141          61

Before we can start building our automobile air pollution models, we need to
know the rates at which automobiles produce the various pollutants. Of course,
this is continually changing as automobile pollution controls become more
severe. We will use 1970 estimates (hopefully, by 1980 or 1990 the values will
be much lower). Also, we will assume a standard velocity of 40 miles per hour.
Do you feel this is a reasonable choice? The rates of pollutant production are
given in Table 2.


Table 2 - Average 1970 Pollutant Production Rates per Automobile Traveling at 40
MPH

Pollutants 			 Rate of Production
Gases  			liters/mile   cubic feet/mile   grams/hour
Org. 			     4.5*         6.4 		    483
NOX 			     3.4** 	  4.8 		    231
SOX 			     0.1***       0.14               11.4
CO 			    54.1 	 76.6    	   2710
			(grams/mile) 			(grams/hour)
Particulates 		     0.5                             20

*Assumes an average molecular weight of 60. Gas volumes computed at standard
temperature and pressure.

**Assumes equal parts nitric oxide and nitrogen dioxide are formed. Average
molecular weight of oxides of nitrogen assumed to be 38.

***Assumes 4 parts sulfur dioxide to I part sulfur rrioxide are farmed. Average
molecular weight of sulfur oxides assumed to be 67.


*This activity is reproduced from the Student Lab booklet Air Pollution from the
Hewlett-Packard Computer Curriculum Series.  Additional Background material and
exercises are in the booklet. The Student Lab book and companion Teachers
Advisor book are available for $1.00 each from Hewlwtt-Packard Computer
Curriculum Project, 333 Logue Avenue., Mountain View, California 94043.


