The Best of Creative Computing Volume 1 (published 1976)
Satellites and computers help manage Earth's Resources (ERTS-1 spacecraft)
smaller, the requirements of the optical system become
more exact. Such problems as general system noise and, in
particular, optical distortion become acute. There seems to
be a lower limit of about 5-10 centimeters set by
atmospheric scattering.
Since there is a loss of detail as the size of the picture
element is increased, the obvious answer is to have two
sensors systems, one with a large field of vision and large
picture elements for large areas survey and locating areas of
interest and a second sensor system for small discrimination
within smaller areas.
To try to put all of this in perspective - without giving
too much detail - let's look at a sketch of a single sensor
for an earth satellite. The sensor's lenses continuously scan
a strip of the planet at right angles to the motion of the
satellite. The motion of the satellite determines the length,
direction and speed of the scan. The strip scanned at any
one instant will be broken down into picture elements.
Thus a strip 185 km (100 miles) long might be broken into
picture elements 15 meters long. Further, exposure time
would be such that the satellite motion would be 15 meters
for each exposure. Thus each exposure or reading of the
sensor would sense a strip 185 km by 15 meters at a
resolution of 15 meters square.
The radiation coming through the lenses of the sensor
would be broken by prisms or filters into the various
spectral bands required. The spectral bands being chosen to
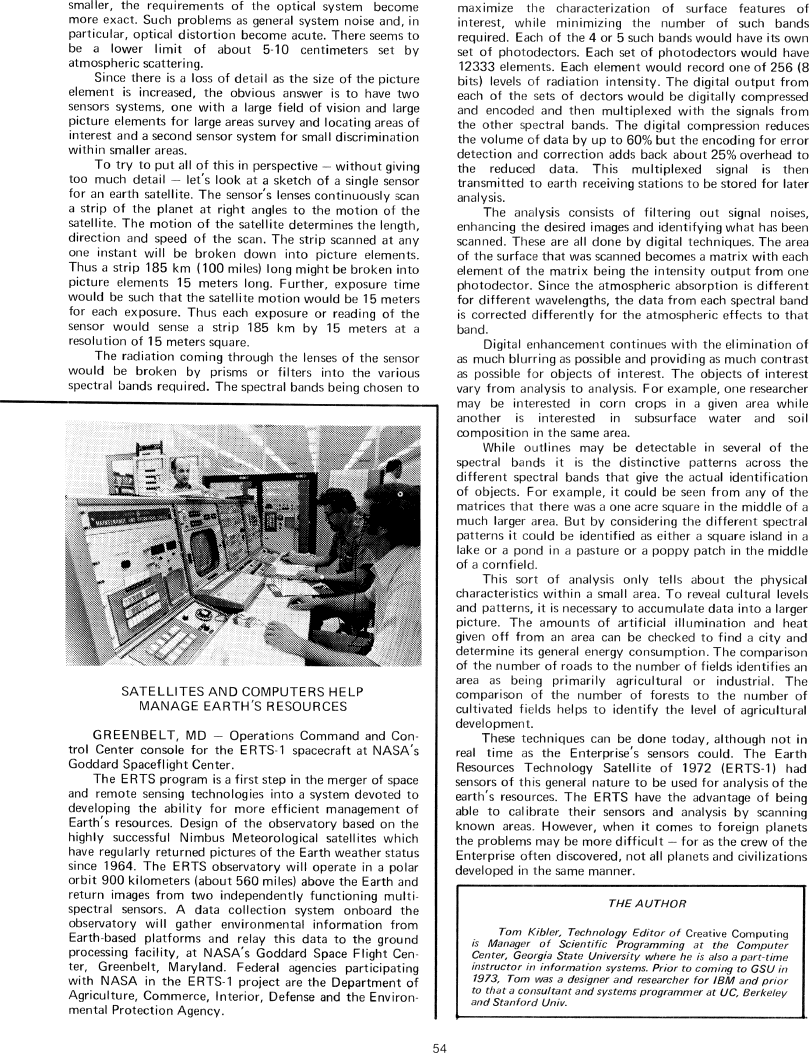
SATELLITES AND COMPUTERS HELP
MANAGE EARTH'S RESOURCES
GREENBELT, MD - Operations Command and Control Center console for the ERTS-1
spacecraft at NASA's
Goddard Spaceflight Center.
The ERTS program is a first step in the merger of space
and remote sensing technologies into a system devoted to
developing the ability for more efficient management of
Earth's resources. Design of the observatory based on the
highly successful Nimbus Meteorological satellites which
have regularly returned pictures of the Earth weather status
since 1964. The ERTS observatory will operate in a polar
orbit 900 kilometers (about 560 miles) above the Earth and
return images from two independently functioning multispectral sensors. A data
collection system onboard the
observatory will gather environmental information from
Earth-based platforms and relay this data to the ground
processing facility, at NASA's Goddard Space Flight Center, Greenbelt, Maryland.
Federal agencies participating
with NASA in the ERTS-1 project are the Department of
Agriculture, Commerce, lnterior, Defense and the Environmental Protection
Agency.
maximize the characterization of surface features of
interest, while minimizing the number of such bands
required. Each of the 4 or 5 such bands would have its own
set of photodectors. Each set of photodectors would have
12333 elements. Each element would record one of 256 (8
bits) levels of radiation intensity. The digital output from
each of the sets of dectors would be digitally compressed
and encoded and then multiplexed with the signals from
the other spectral bands. The digital compression reduces
the volume of data by up to 60% but the encoding for error
detection and correction adds back about 25% overhead to
the reduced data. This multiplexed signal is then
transmitted to earth receiving stations to be stored for later
analysis.
The analysis consists of filtering out signal noises,
enhancing the desired images and identifying what has been
scanned. These are all done by digital techniques. The area
of the surface that was scanned becomes a matrix with each
element of the matrix being the intensity output from one
photodector. Since the atmospheric absorption is different
for different wavelengths, the data from each spectral band
is corrected differently for the atmospheric effects to that
band.
Digital enhancement continues with the elimination of
as much blurring as possible and providing as much contrast
as possible for objects of interest. The objects of interest
vary from analysis to analysis. For example, one researcher
may be interested in corn crops in a given area while
another is interested in subsurface water and soil
composition in the same area.
While outlines may be detectable in several of the
spectral bands it is the distinctive patterns across the
different spectral bands that give the actual identification
of objects. For example, it could be seen from any of the
matrices that there was a one acre square in the middle of a
much larger area. But by considering the different spectral
patterns it could be identified as either a square island in a
lake or a pond in a pasture or a poppy patch in the middle
of a cornfield.
This sort of analysis only tells about the physical
characteristics within a small area. To reveal cultural levels
and patterns, it is necessary to accumulate data into a larger
picture. The amounts of artificial illumination and heat
given off from an area can be checked to find a city and
determine its general energy consumption. The comparison
of the number of roads to the number of fields identifies an
area as being primarily agricultural or industrial. The
comparison of the number of forests to the number of
cultivated fields helps to identify the level of agricultural
development.
These techniques can be done today, although not in
real time as the Enterprise's sensors could. The Earth
Resources Technology Satellite of 1972 (ERTS-1) had
sensors of this general nature to be used for analysis of the
earth's resources. The ERTS have the advantage of being
able to calibrate their sensors and analysis by scanning
known areas. However, when it comes to foreign planets
the problems may be more difficult - for as the crew of the
Enterprise often discovered, not all planets and civilizations
developed in the same manner.
THE AUTHOR
Tom Kibler, Technology Editor of Creative Computing
is Manager of Scientific Programming at the Computer
Centen, Georgia State University where he is also a part-time
instructor in information systems. Prior to coming to GSU in
1973, Tom was a designer and researcher for IBM and prior
to that a consultant and systems programmer at UC, Berkeley
and Stanford Univ.