STROKE GRAPHICS AND RASTER SCAN: THE OLD AND THE NEW
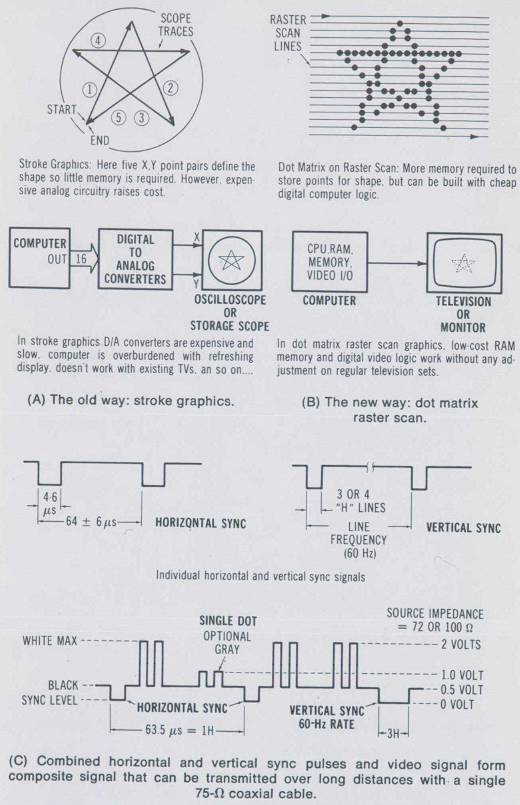
In the early years of computer graphics the main display device was not a standard television screen but rather an expensive cathode-ray tube (crt) like the kind found in oscilloscopes. Like an oscilloscope, the display had an X and Y in-ics because the display is sent voltage point pairs and the beam in the crt to a point proportional to the amplitudes of the input signals. We call such a display technique stroke graphics because the display is sent voltage point pairs and the beam draws a line in one stroke from the last point to the current point. See Fig. 2-1A. This is also called vector graphics.
In stroke graphics we need a computer to generate the points that define the shape to send to the display and an expensive digital-to-analog converter (dac) to convert these digital points to voltages for the crt. Since the dac contains complex analog circuits that must be trimmed periodically and since it contains temperature dependent components the stroke graphics method is favored only when money is no object. Of course you can build a low-cost stroke graphics display using 8-bit dac's but it will never compete with the digitally derived displays.
The most popular method for graphics displays today takes advantage of the fact that there are literally hundreds of millions of television sets in the world. All television sets rely on a technique called “raster scanning.” In raster scanning the crt beam is deflected in a weaving pattern that sweeps across the screen and down many times per second as shown in Fig. 2-1B.
A television broadcasting station sends a signal to the television that contains special synchronizing pulses. Circuits in the tv use the “sync” pulses to get in step with the transmitted signal. There are horizontal sync pulses for starting the horizontal sweep of the beam and vertical sync pulses for starting the vertical trace of the beam. In between these sync pulses is the video information, also in the form of pulses, that makes up a single horizontal line on the display screen. There are up to 512 of these lines on the tv screen. Up to 1024 points can be defined on a single one of the 512 lines. See Fig. 2-1C.
Most of the time the beam is off. If the computer is properly synchronized to the sweeping beam it can turn it on at any point in the display's X, Y plane and thus form a dot there. The raster scanned television screen can thus be imagined as a superdense matrix of about 1024 dots by 512 lines that is sent to the tv line by line. Thus if the beam is turned on at specific locations on the screen we get a shape made of tiny points. This all may seem even more complex than stroke graphics, but it turns out that raster scanning seriously reduces the need for analog circuits and allows a totally digital display to be built. On the minus side, raster scanning means we must store all the dots that make up a shape rather than just the end points of vectors as in stroke graphics. This means much more memory. However, since memory is being halved in price every year, raster scanning has become the best approach to low-cost graphics displays. Furthermore, there are tricks that designers can use to make a digital raster scan display act just like a vector graphics display, as we will see.
Return to Table of Contents | Previous Section | Next Section