YOUR. OWN
STOCKBROKER
by Norm Nicholson

Norm Nicholson is editor of the bimonthly newsletter Computerized Investing, published by the American Association of Individual Investors, 612 N. Michigan Ave., Chicago, IL 60611.
Yes, you can replace your stockbroker with a microcomputer. Personal computers coupled with software for investment analysis and data communications make it possible for the individual at home to perform exactly the same types of investment research undertaken by large investment brokers and financial institutions.
By executing trades through a discount broker, you may even be able to save some money in the process. Before you begin, however, think it over carefully. Many people value their broker's advice or have a psychological need to talk over their investment ideas with another person. Also bear in mind that computers can offer bad advice as easily as brokers can.
Should you ultimately decide you want to keep your broker, a personal computer can still be very useful. For example, there are several portfolio management programs on the market that can keep a record of your securities transactions, provide an accounting record of your long- and short-term transactions for tax purposes and monitor the overall yield on your portfolio. Going one step further, the new generation of personal financial management programs can oversee your budget, handle your checking, advise on insurance, IRAs and Keogh plans, evaluate real estate purchases, help you fill out your tax forms, aid in retirement planning and keep track of your net worth. Some of the new personal finance packages are sold as individual modules that are purchased separately; with these, you usually begin with a basic budgeting and checking program, and add on as your needs dictate. Other companies offer a complete financial management system in one package, geared to those interested in managing their assets or planning for their financial future.
Getting Started
If you decide to do financial planning or investment analysis via computer, where do you begin? First, of course, you need a suitable microcomputer. Investment analysis programs require a fair amount of user memory (usually 64K or more). In many cases, programs furnished on one disk make use of a second disk containing market data; this means you'll want to equip your system with two disk drives. In addition, a dot-matrix printer with graphics capability is useful for printing reports and graphs.
Most investment software currently on the market was developed for the Apple or IBM PC computers. A number of programs for the IBM PC have also been converted to run on similar computers, such as the Texas Instruments Professional and Tandy 2000. A word of caution is necessary: you should make sure that software is available to do the tasks you have in mind before, not after, you buy the computer.
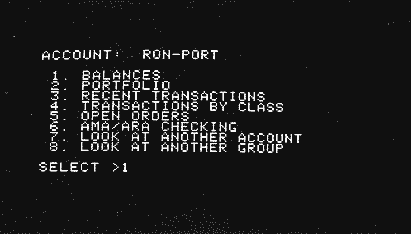
If you're an active trader, it's possible to trade your portfolio from your home or office via a personal computer sitting on your desk. Major discount brokers, such as Fidelity Brokerage Services, can provide software that allows your computer to link automatically into a real-time securities market quotation system. ("Real-time" means the market quotes on your computer screen are the actual last sale prices posted on the exchange.)
You will pay approximately $200 for the software, which some brokerage firms offset against commissions. You will also have to pay for the telephone charges, which are usually local call rates, and for the use of the quotation system itself. Obviously, the charges can quickly add up. But for active stock traders with large positions and individuals with highly leveraged options positions, timely information can be well worth the cost. Some software packages for online order execution systems will also provide detail ed statements of your brokerage accounts.
For less active traders, one way to reduce charges considerably is to receive quotes on a fifteenminute delay basis. Exchange fees for data connections are considerably less for delayed service. If you're a long-term investor who wants to track stock prices for research purposes or simply update the value of a stock portfolio, it's possible to log onto one of the financial information services like Dow Jones News/Retrieval during evening hours and pay only a dollar or so for the quotes you need. Then all you have to do is simply phone your discount broker when you want to make a purchase or sale.
Microcomputers are also ideal tools for investment research. They can process and manipulate large amounts of data rapidly, and through the skillful use of graphics they can present information in a quickly understandable format. Most important, you can interact with the computer to follow up on ideas that spring from the information currently being displayed on the screen.
The Home Analyst
Personal computer investment software usually performs one of two kinds of analysis: fundamental or technical. Fundamental analysis is the process of identifying stocks that meet specific stock-valuation or financial-performance criteria. Technical analysis applies primarily to the forecasting of future performance of the market or specific stocks on the basis of price and volume data over time for specific stocks, and for indices of the market as a whole.
Until very recently, the costs of doing fundamental analysis were beyond the means of most individuals. For example, the yearly cost for Compustat, a commercial data base consisting of fundamental market information, typically starts at $20,000 per year and ranges upwards from there. Now, however, there are several programs on the market that can screen a large universe of stocks for selected performance characteristics. Stock screening programs usually come with a program disk and separate data disks that are updated monthly. Prices for stock screening programs typically range from $300 to $1,000.
As an illustration of fundamental analysis, let's say we've read that smaller capitalization stocks have outperformed the market as a whole, even after accounting for the higher intrinsic risk associated with smaller companies. We might, for the sake of argument, choose stocks with a book value of between $25 million and $125 million, a price/earnings ratio of 12 or less and a "beta" of 1.2. (Beta is an index of a stock's risk relative to the market as a whole; stocks with a beta greater than one should outperform the market, either up or down.) In a few minutes our program would have searched through its data base and given us a list of stocks that passed the screen.
If we were really doing the research outlined above, we would also look into basic financial soundness of the companies passing the screen, the demand for their products and their competitive position in the marketplace. From our final list, we could then rank the stocks based on their valuation relative to the market. Now we are in a position to purchase stocks for our portfolio. The fundamental approach to stock selection, as outlined above, is often used by professional portfolio managers in picking stocks for prospective long-term holdings.
Technical analysis refers to a wide variety of techniques for manipulating and graphing market price and volume data. The resulting indicators are then used in determining when to buy and sell securities. A typical use of this kind of analysis consists of plotting daily price movements on one graph and a moving average of the same data on another. The two graphs are then simultaneously displayed on the screen. If the daily price graph crosses the moving average on the upswing, a buy signal is given. A crossing on the downswing gives a sell signal. Most often, additional indicators would be computed in order to confirm a buy or sell signal.
There are several technical analysis programs on the market that can automatically log into a financial information system, obtain price data and then compute the graphs you need. Because of the sophistication of the software, technical analysis requires less effort than fundmental analysis. It's also a good deal more controversial. Several academic studies have come to the conclusion that day-to-day movements in market prices behave in a highly random fashion and that future trends in market prices cannot be predicted solely on the basis of past market behavior. During a prolonged upswing (or downswing) in market prices, technical analysis performs well. But when the market is highly volatile or moving sideways, technical analysis systems generate false buy and sell signals.
Some technical analysis programs come with a data base diskette containing economic and market statistics. During the beginning of the stock market run-up in August 1982, for example, when the airlines industry was underperforming the market as a whole, comparing plots of the industry index and a broad market index such as the Standard and Poor's 500, would have easily spotted the relative undervaluation. Some additional research would have revealed a good buying opportunity.


More Investment Tools
In addition to the commercial programs discussed above, many mathematically inclined individuals and financial professionals develop their own portfolio management systems and investment models. Integrated spreadsheet modeling programs, such as Lotus' 1-2-3 or the newer program Symphony, can be used to create almost any type of model that an investment analyst could wish for. In the newer programs, data can be automatically retrieved from a financial information service using built-in communications routines. With older programs, special software such as the Dow Jones Spreadsheet Link can retrieve data for use with the spreadsheet program. Many of the latest spreadsheet modeling programs also have the ability to display graphics and manipulate a data base.
There is also a wide variety of highly specialized programs for bonds, options and futures market analysis. Very sophisticated programs for statistical analysis that were originally written for large mainframe computers are now available on micros. One could, in theory, develop a statistical model of the economy using only a microcomputer and currently available software.
There are innumerable sources of information available to investors. Most financial mgazines and many computer publications are now devoting space to the topic. The American Association of Individual Investors has a nationwide seminar program. AAII members have also formed computer interest groups in many of the larger metropolitan areas.
When all is said and done, microcomputers and investment software are really only tools to aid the investor in making intelligent decisions. It is your own knowledge, aided by the information gathering and high-speed processing capabilities of the computer, that can lead to superior investment performance.
Return to Table of Contents | Previous Article | Next Article

